
Does it hit every cancer cell
A target that reaches only a fraction of a tumour inevitably leaves part of it behind. That is why coverage—the fraction of cancer cells expressing a target—is one of the most informative measurements we can make in an individual patient. It is also a measurement that cohort studies often obscure, because averaging across patients smooths away the very heterogeneity that determines whether a therapy succeeds.
Importantly, coverage is only one part of the story. Some targets are designed to attack cancer cells directly, while others deliberately target the tumour microenvironment. FAP belongs to the latter category, yet in this patient's osteosarcoma it is notable that FAP is expressed not only by stromal fibroblasts, but also by a substantial fraction of the cancer cells themselves—a pattern that differs from many epithelial solid tumours.
The result first
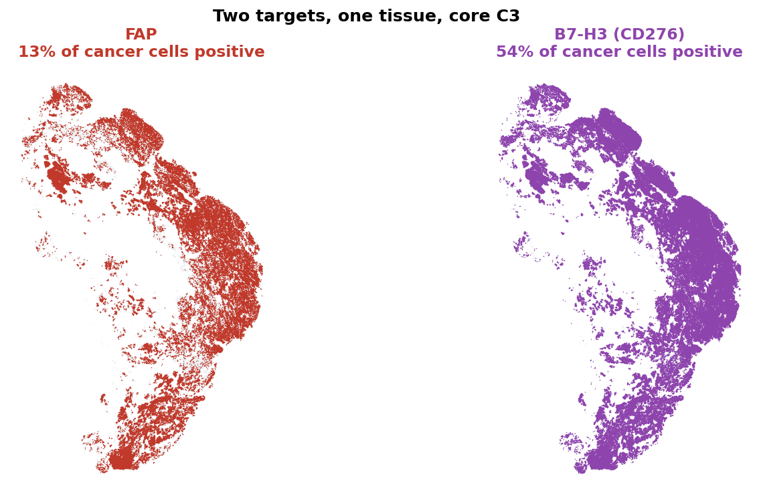
Two targets, one slice of this patient's tumour, 381,287 cells read one at a time. Every coloured dot is a cell carrying the target. B7-H3 is on 57% of the cancer cells. FAP is on 17%.
Both of these are real clinical targets and FAP passed more comfortably. On the measurement that decides whether a drug can clear a tumor, one of them is three times better than the other.
Counting cells
Coverage sounds simple: what fraction of cancer cells carry the target. It is not, because the answer depends strongly on sequencing depth.
The median cancer cell carries 7,350 transcript counts in the June biopsy and 24,228 in January. Sequence a cell three times more deeply and you detect more genes, increasing its apparent coverage. Comparing June and January without correcting for depth measures the sequencing run rather than the biology.
Every cancer cell was therefore downsampled to a common depth of 4,000 counts before analysis. Cells that never reached 4,000 counts were excluded rather than artificially up-weighted. That leaves 938 cells from June and 2,012 from January.
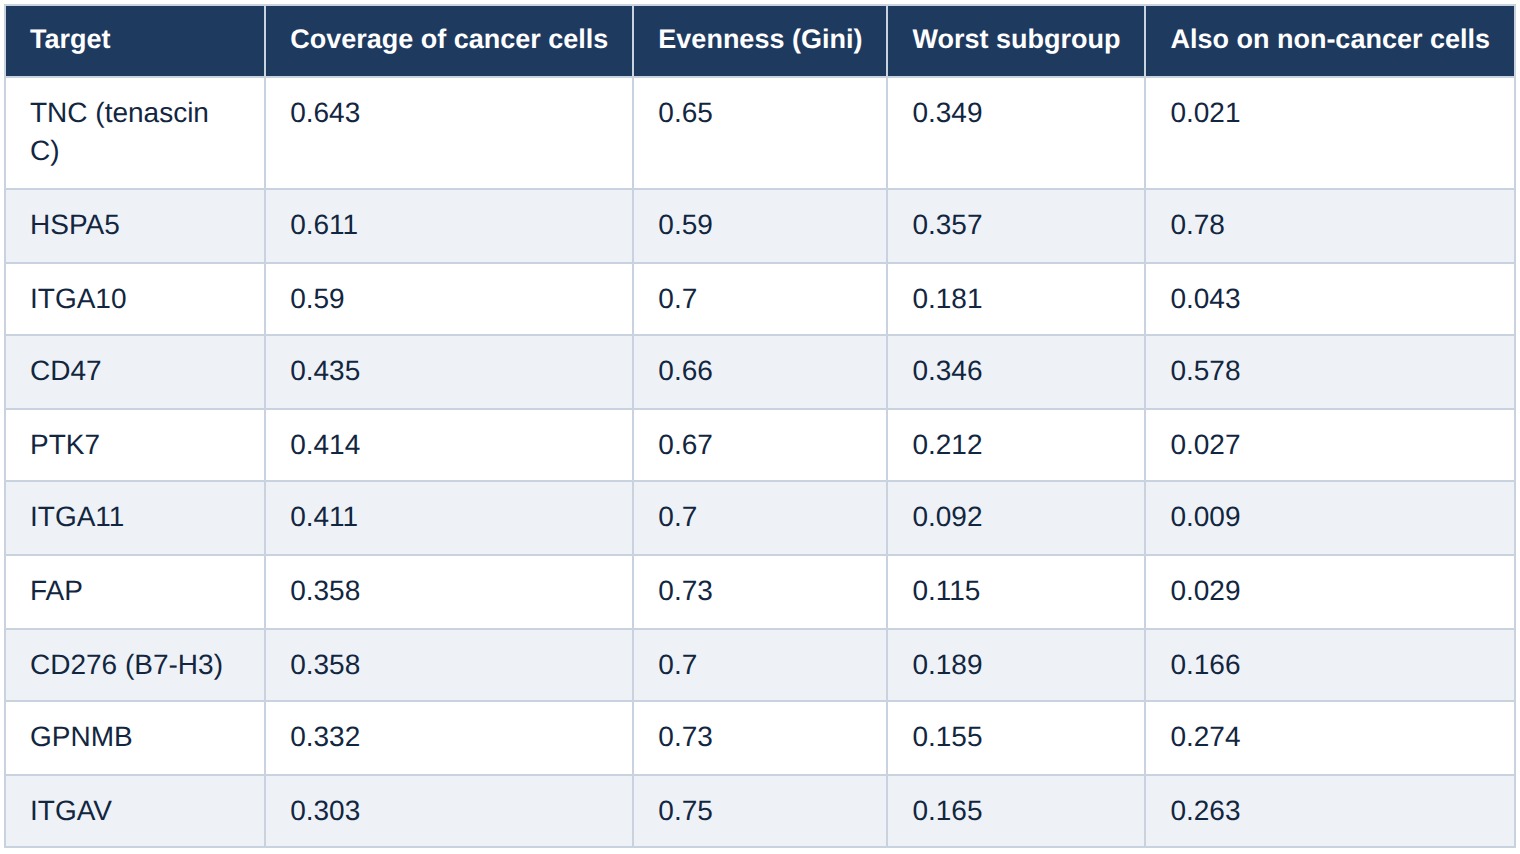
Four columns, four different ways to fail.
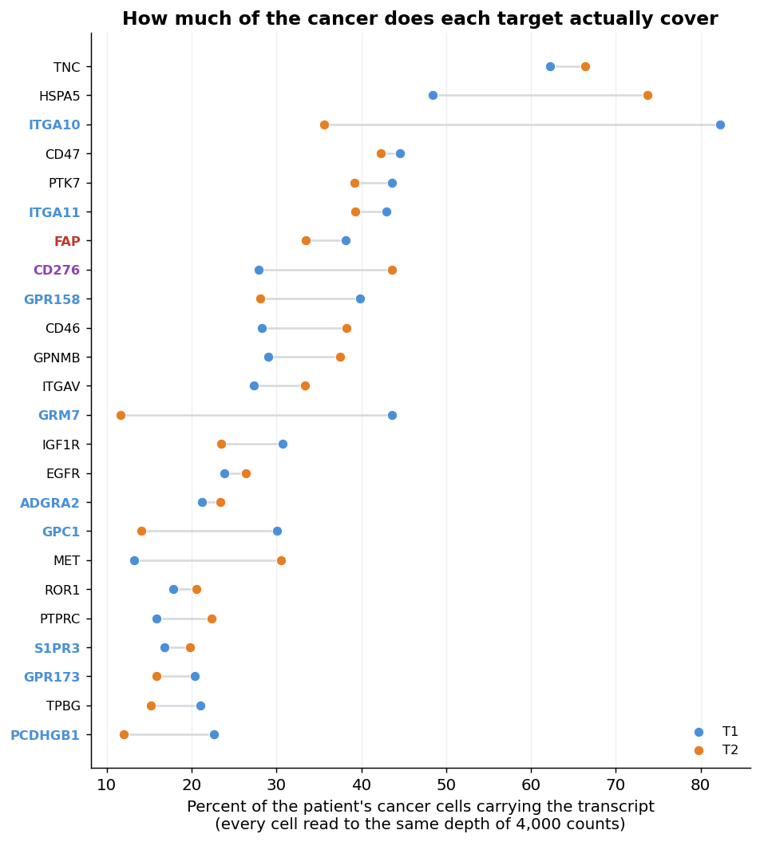
Coverage is the headline. TNC reaches 64% of cancer cells, and the bottom of the comparator list reaches under 2%.
Evenness is the Gini coefficient of expression across cancer cells. Zero means every cancer cell carries the same amount. One means all the signal is in a single cell. Nothing here is below 0.54, which is worth sitting with: even the best target in this tumour is distributed unevenly across the cells that carry it.
Worst subgroup is where a potential escape route can show up. The cancer cells split into nine subgroups, and this column is the coverage in whichever subgroup is covered least.
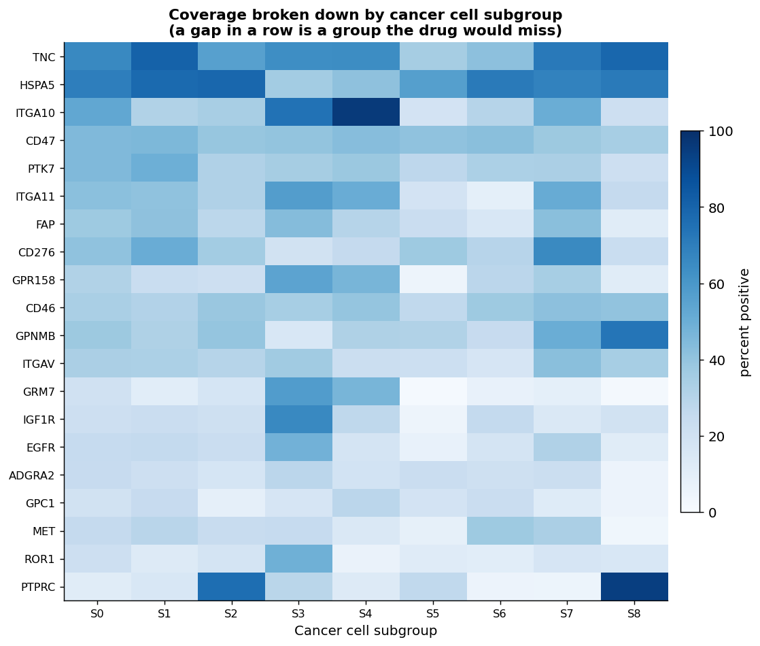
For example, ITGA11 covers 41% of cancer cells overall but only 9% of its weakest subgroup. ITGA10 covers 59% overall and 18% at its weakest. FAP covers 36% overall and 11.5% in its least-covered subgroup. TNC remains the most balanced among the leading candidates, maintaining 35% coverage even in its weakest subgroup.
Finally, non-cancer expression reflects potential on-target effects outside malignant cells. HSPA5 and CD47 show broad expression across essentially all cell types, limiting their attractiveness as tumour-selective targets. In contrast, FAP maintains relatively low expression across non-cancer cells outside its expected fibroblast compartment.
Rather than identifying a single "winner," these measurements illustrate the trade-offs among different targeting strategies. If maximizing direct cancer-cell coverage is the primary objective, targets such as TNC or ITGA10 rank highly. FAP offers a different profile: moderate cancer-cell coverage combined with biology that also enables targeting of tumour-associated fibroblasts.
Coverage and expression are not independent
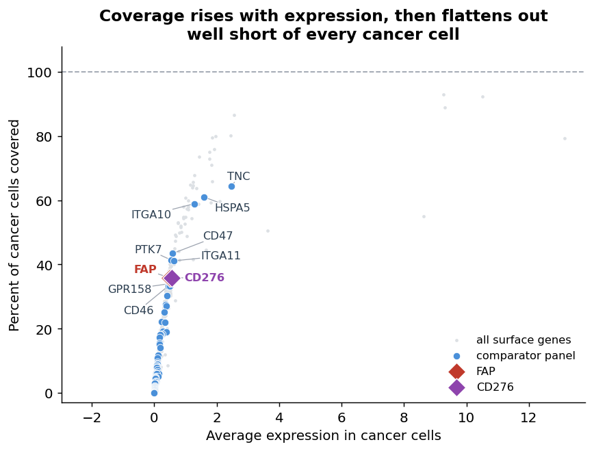
One might expect coverage to provide information beyond average expression.
In this tumour, it mostly does not.
Coverage increases with expression along a saturating curve before plateauing well below 100%. Even the highest-expressing targets fail to reach every cancer cell.
Complete coverage simply is not available in this tumour. The practical question is therefore not whether a target reaches every cancer cell, but which target comes closest while maintaining an acceptable biological profile.
The same tumour in place
Single-cell sequencing tells us which cells express a target.
Spatial profiling tells us where those cells are.
Finding the tumour inside the slice
There is no pathologist annotation on these cores, so the tumour region had to be defined from data. We used the 60-gene signature learned from this patient's own cancer cells, scored it on every square of tissue, and thresholded.
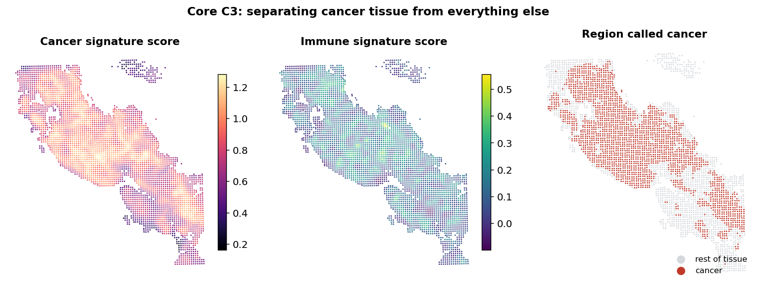
Two practical decisions went into that figure, and both changed the answer.
The 32-micrometre squares carry a median of only 87 counts in core B3 and 152 in core C3. At that depth, whether a gene is detected in a square is mostly a statement about sequencing. Squares were therefore pooled two by two into 64-micrometre squares, which brings the median to 530 and 724 counts. 5,053 squares in B3, 3,848 in C3.
Thresholding the signature square by square still produced a salt-and-pepper mask that followed noise rather than tissue. Averaging each square with its eight neighbours twice, about a 190-micrometre neighbourhood, produced the coherent mask above: a dense tumour body with a rim of other tissue. 78% of B3 and 59% of C3 is tumour, which is what you expect from a core punched out of a tumour.
What the tissue shows
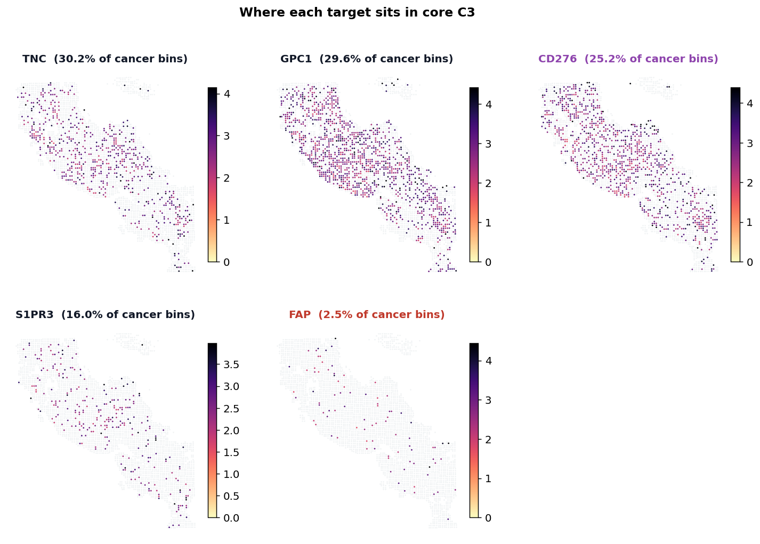
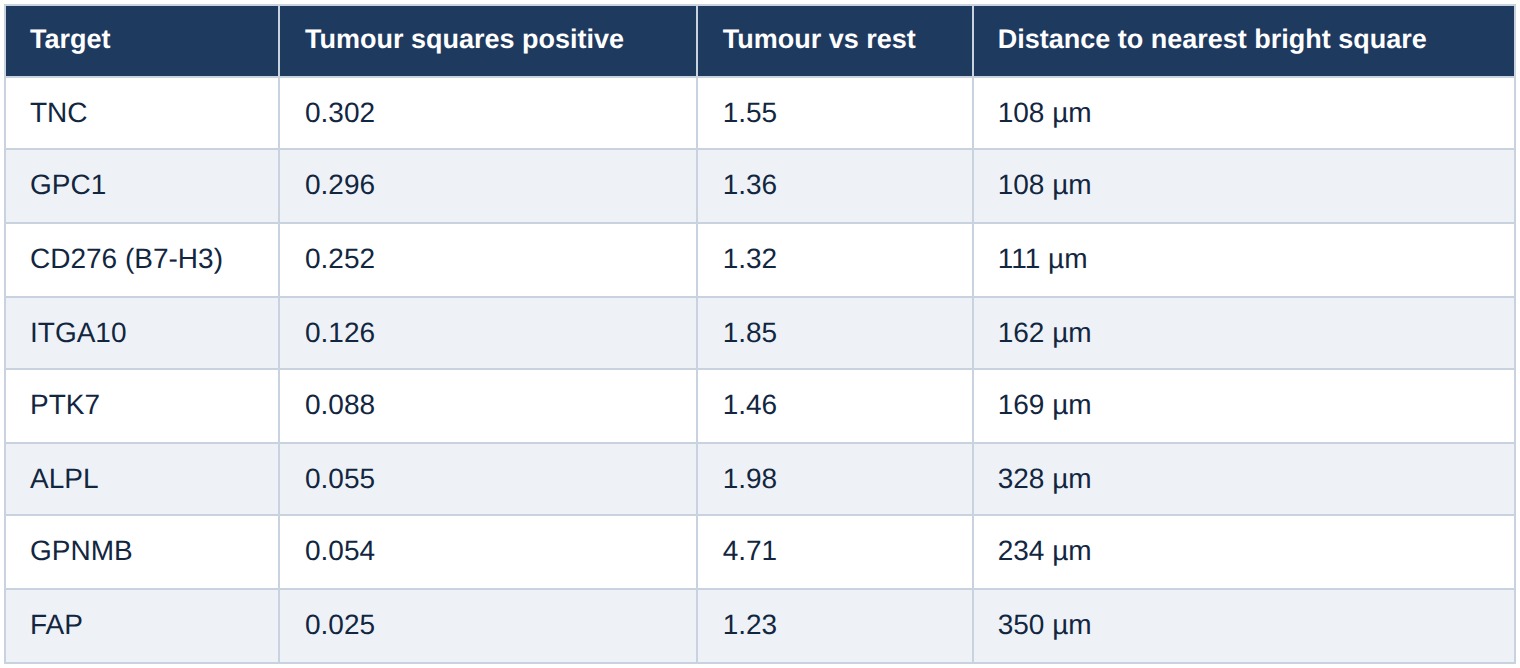
For radiopharmaceutical therapy, the final column is particularly informative.
A Lu-177 beta particle travels approximately 280 μm.
The average distance from a dim square to the nearest strongly CD276-positive square is 111 μm, well within this range.
For FAP, the corresponding average distance is 350 μm, reflecting a more spatially sparse pattern. This reflects the fact that FAP expression is concentrated within stromal compartments rather than being uniformly dispersed throughout the tumour.
This observation does not diminish the value of FAP. Instead, it illustrates that FAP-based therapies operate through a different spatial biology than tumour-cell targets such as B7-H3. Direct cancer-cell targets benefit from continuous tumour coverage, whereas FAP-targeted agents primarily exploit the tumour-supporting stroma.
One cell at a time
Each 64-μm square contains multiple cells. Xenium resolves them individually.
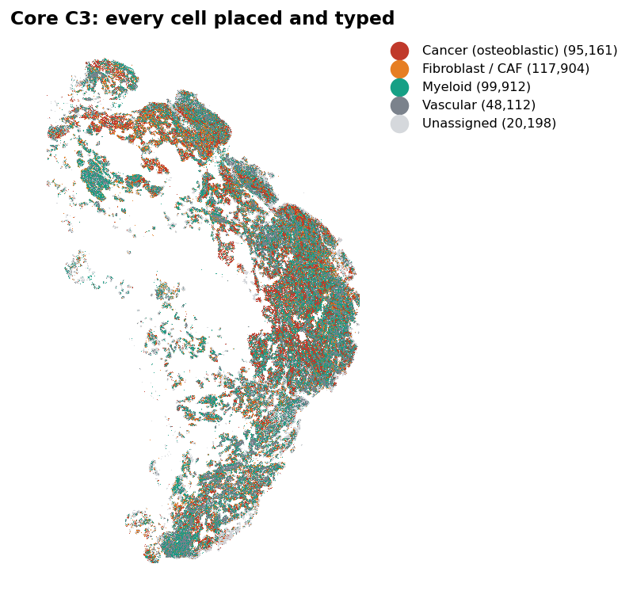
Across both tissue cores, 624,816 cells were classified into cancer cells, fibroblasts, myeloid cells, T/NK cells and vascular cells.
The cancer signature deliberately excluded collagen genes because both osteosarcoma cells and cancer-associated fibroblasts produce extracellular matrix. Likewise, FAP itself was excluded from the fibroblast signature so that it could be evaluated independently.
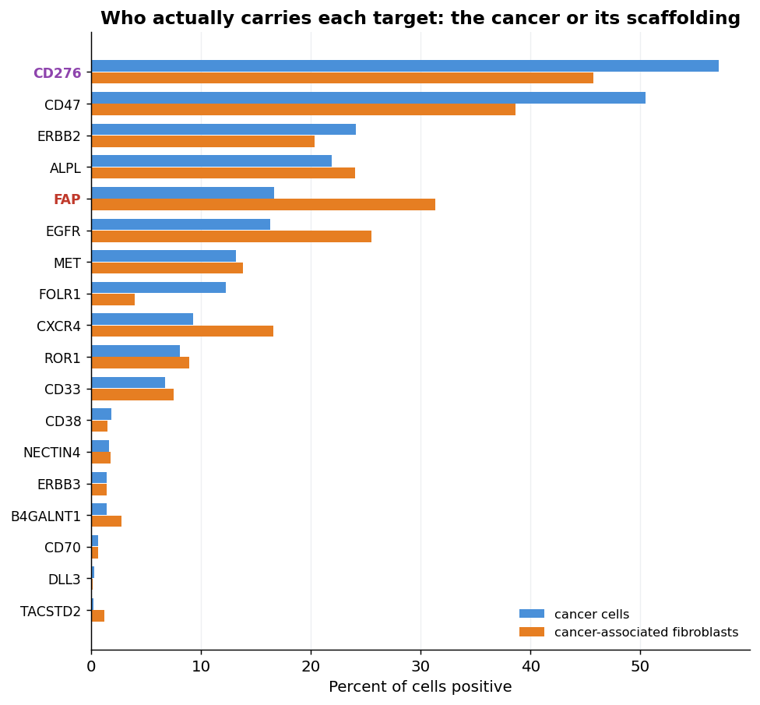
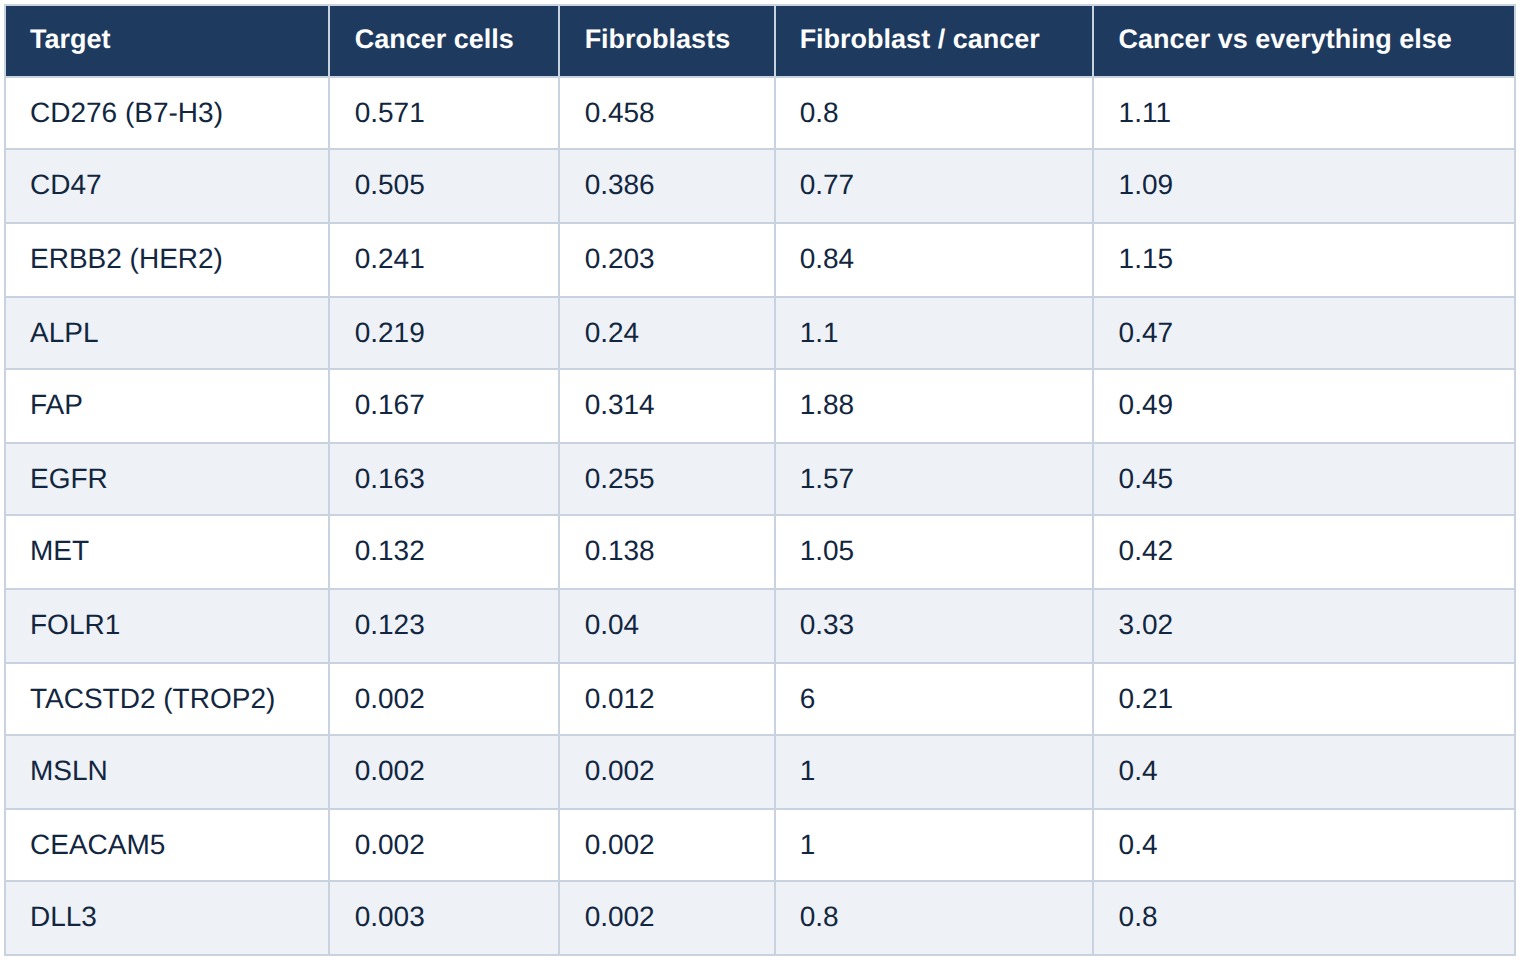
This table captures the biological distinction between targeting strategies.
FAP remains enriched in cancer-associated fibroblasts, as expected, but importantly it is also detected on nearly one in six cancer cells. That distinguishes this osteosarcoma from many epithelial solid tumours, where FAP expression is largely confined to stromal fibroblasts. In this patient, a FAP-directed radioligand would therefore have the opportunity to interact with both tumour stroma and a meaningful subset of malignant cells.
B7-H3 offers broader direct cancer-cell coverage, reaching 57% of cancer cells, making it the strongest conventional tumour-cell target in this dataset.
The comparison is therefore not that one target is "good" and the other "bad." Rather, if all other factors—including pharmacology, safety and therapeutic modality—were equal, broader cancer-cell coverage would favour B7-H3. FAP, however, provides a biologically complementary strategy by simultaneously engaging tumour-associated fibroblasts and a significant fraction of osteosarcoma cells.
Equally informative are the targets that are essentially absent. TROP2, mesothelin, CEACAM5 and DLL3 each appear in fewer than one cancer cell per 300. Regardless of clinical success in other tumour types, they are unlikely to be useful targets in this patient.
Two instruments, one answer
The two platforms disagree on absolute percentages but agree remarkably well on ranking.
B7-H3 is detected in 25% of 64-μm tumour squares and 57% of individual cancer cells.
FAP is detected in 2.5% of tumour squares and 17% of individual cancer cells.
Different technologies, different sensitivities and different denominators nevertheless produce the same ordering.
That concordance is more important than the absolute numbers themselves.
Because the two technologies fail in different ways, agreement between them strongly suggests that the biological ranking is robust.
Comparing against the usual suspects
Eighty-seven candidates. Eight measurements each. One number.
The candidates are everything we could reasonably compare: the 29 targets discovered in this patient's data, the targets that radiopharmaceutical companies currently have programmes against, the antibody-drug conjugate targets including every approved one we could get data for, and the targets with a specific history in osteosarcoma. Some genes are on more than one list, which leaves 87 in total.
They are all scored the same way, on the same patient, with the same eight measurements. A target does not get credit for being famous.
The result first
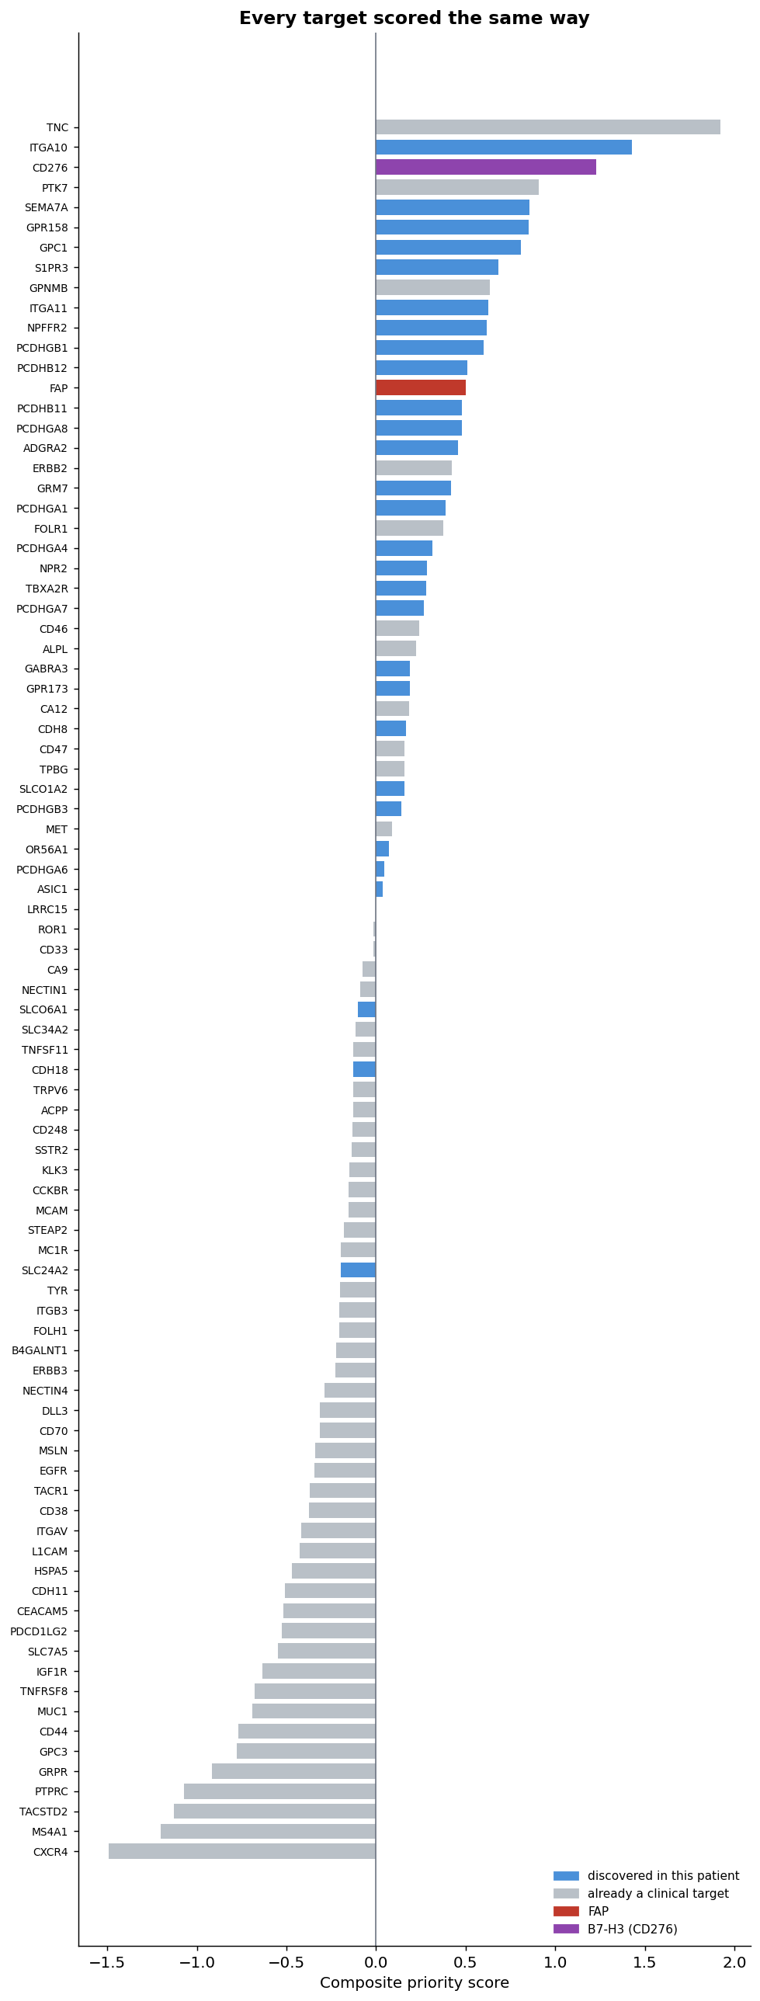
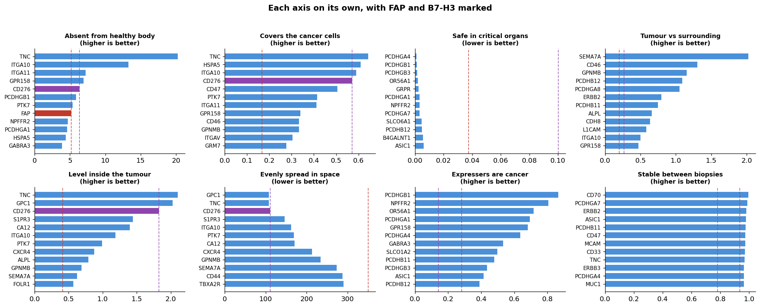
Blue is discovered in this patient. Grey is an existing clinical target. Red is FAP, purple is B7-H3.
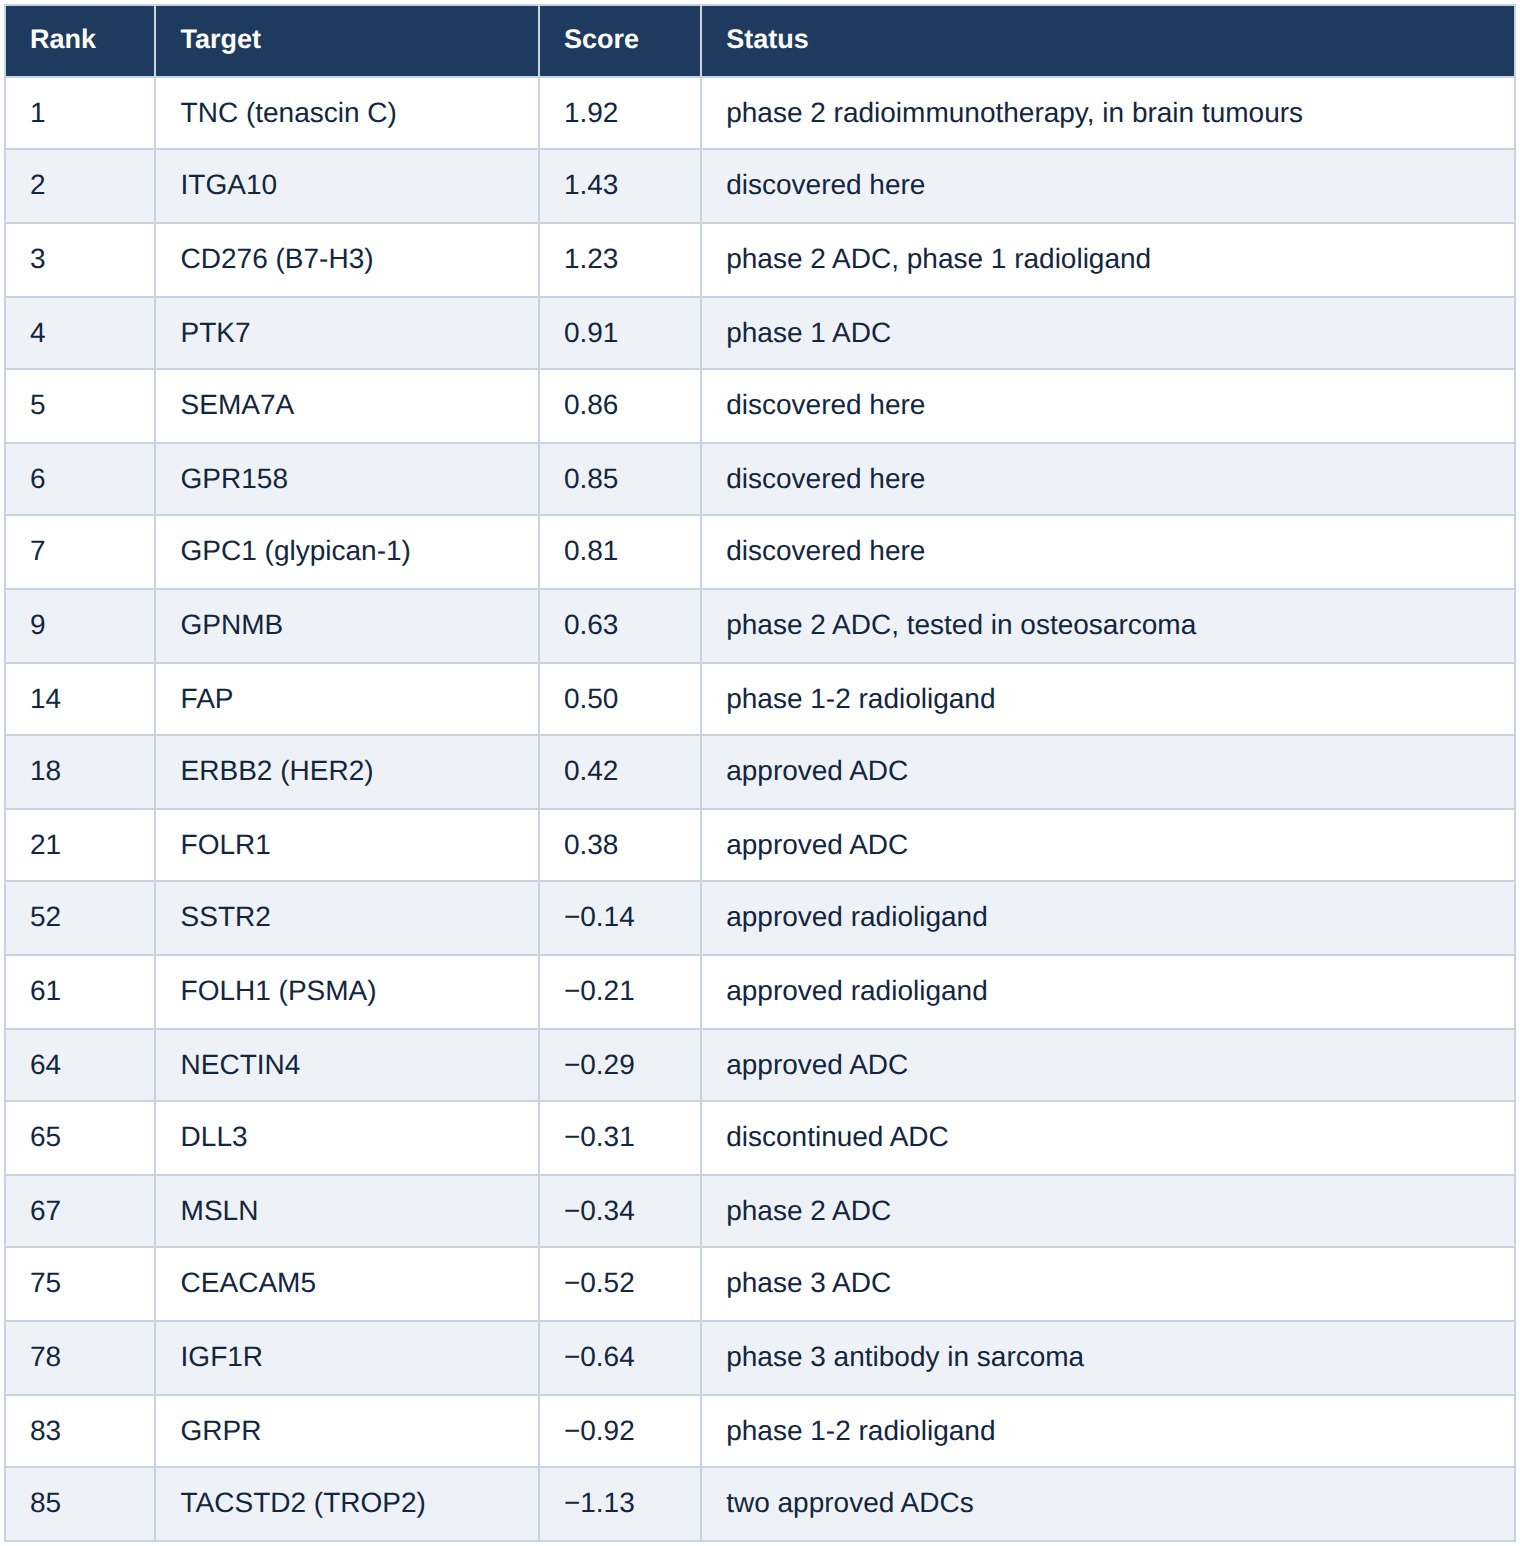
Two things in that table are worth stating plainly.
B7-H3 is the highest-ranked mainstream target, at 3 of 87. Among clinically advanced targets, it is the one that best fits this patient's data.
FAP is 14th. Respectable, not top ten, and for the reason in the previous section.
How the score is built
Eight measurements, fixed weights, summed. Each measurement is converted to a z-score across the 87 candidates first, so they are comparable, and a missing measurement contributes the average of its axis rather than dropping the gene.
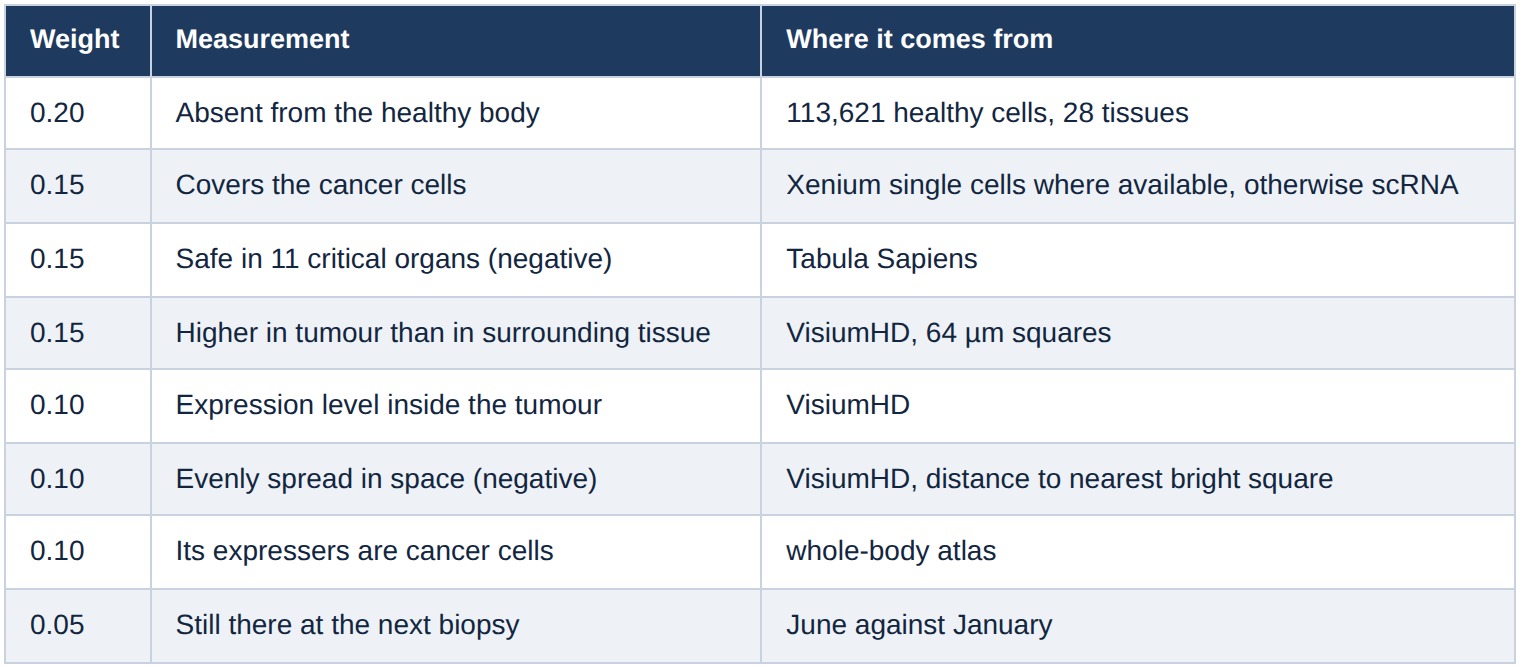
Six of these eight are the standard PortraiTARGET checkpoints, with the standard weights. Two are additions this dataset made possible: coverage of the cancer cell population, and stability between two biopsies. Coverage got a 0.15 weight taken from the axes that turned out to be weak here, and we should say why.
The reference pipeline gives 0.10 to how much higher a target is in the tumour than in the neighbouring organ. For a bone tumour that axis does not work: Tabula Sapiens contains bone marrow but not bone, so the comparison is against the wrong tissue. One target produced a fold change of 314 million, which is a division by nearly zero rather than a biological finding. The axis was dropped and its weight moved to coverage, where the data is solid.
Stability got only 0.05, deliberately. With two usable time-points it is a weak measurement, and the roughly seven-month gap between June and January is short compared with how long a drug programme takes.
What each axis contributes
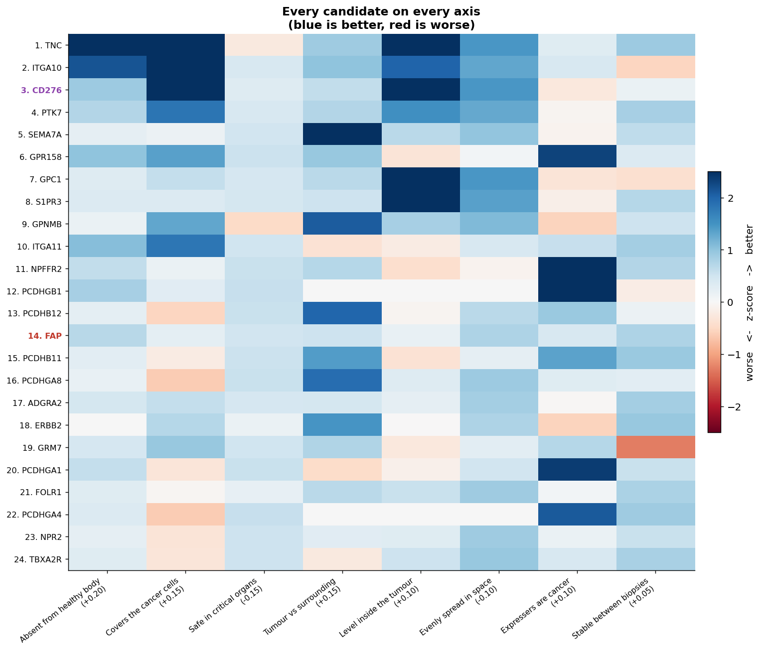
Blue is better, red is worse. The value of the picture is that it shows why a target ranks where it does, and no target is good at everything.
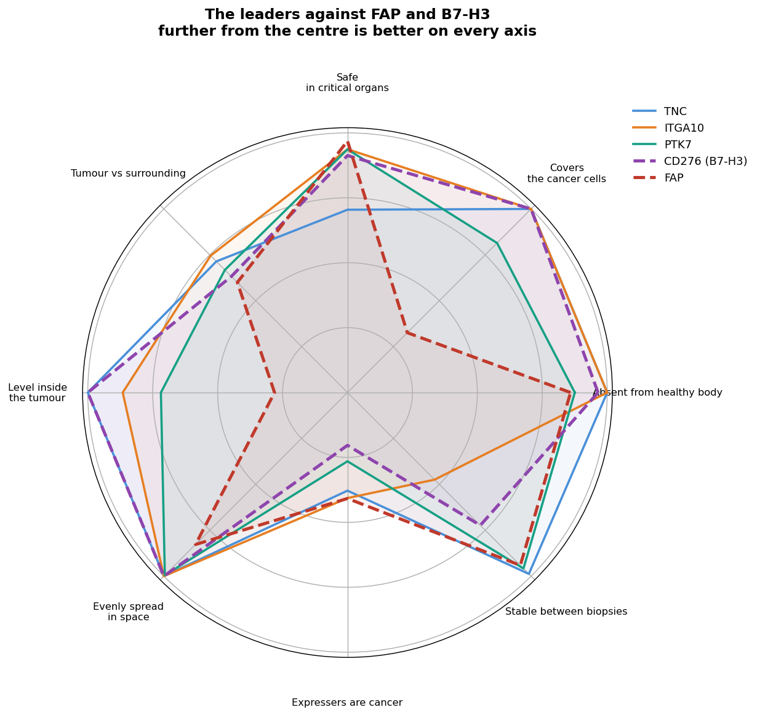
Further from the centre is better on every axis. Nobody is furthest out everywhere.
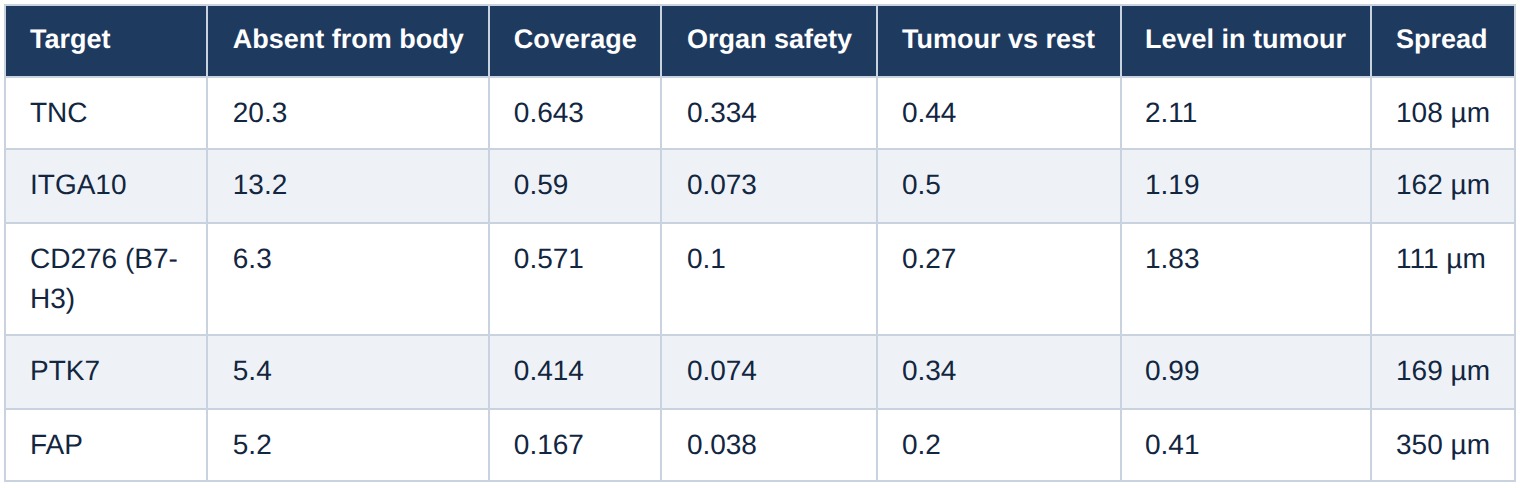
Read down the columns and the trade-offs are explicit. TNC leads on four of the six and has the worst critical-organ safety of the group, driven by skin. ITGA10 is the best compromise: second on coverage, best tumour-versus-surrounding ratio, and four times safer than TNC in critical organs. B7-H3 is the most balanced of the mainstream targets, strong on coverage and spatial spread while giving up ground on whole-body specificity, which is what you would expect from a protein that also appears on normal tissue at low level. PTK7 trails the other three on every axis except safety.
FAP is the only one of the five whose polygon contracts substantially. It matches the field on safety but scores lower on the cancer-cell-centric axes, which do not fully capture its stromal targeting rationale.
The three at the top
TNC, tenascin C. An extracellular matrix protein, on 64% of cancer cells, the most evenly covered of the leaders, the tightest spatial spread in the tissue, and it has been targeted before: 131I-81C6 was an antibody-radiation conjugate tested in brain tumours. Its weakness is safety. It is the weakest of the top ten on the critical-organ measure, driven by skin, where it scores 0.31 against 0.16 for B7-H3. Any programme against it would have to deal with that.
ITGA10, integrin alpha-10. The best of the discovered targets. 13-fold enriched in cancer over the healthy body, almost invisible in the critical organs, 59% coverage of cancer cells. It is also the most interesting result in the series, because we did not go looking for it: it came out of an unbiased comparison against Tabula Sapiens. Only afterwards did we find a published argument that integrin alpha-10 drives sarcoma growth and is a target with unusually narrow normal-tissue distribution, with antibodies made and tested in animals. Nothing against it appears to have reached a clinical trial, so this is convergence with somebody else's preclinical work rather than with an approved drug. That is still worth something: it is independent arrival at the same place from one patient's leftover tissue.
One caution on ITGA10 that the table does not show. Its coverage was 82% in June and 36% in January, the largest drop of any top candidate, giving it the weakest stability score in the top ten. With two timepoints we cannot tell whether that is real change under treatment or sample-to-sample variation, and it is the first thing we would want a third timepoint for.
CD276, B7-H3. The only mainstream target near the top, and the only one of the three that already has a drug in trials: ifinatamab deruxtecan is in phase 2, including in sarcoma, and there are B7-H3 radioligands in phase 1. On this patient it is on 57% of cancer cells, the highest of any target on the Xenium panel, and its signal is tightly enough packed in space that a Lu-177 beta particle bridges the gaps.
Its weakness is the axis where the discovered targets beat it. B7-H3 is 6-fold enriched over the healthy body against 13-fold for ITGA10 and 20-fold for TNC, and it is on 17% of the patient's own non-cancer cells against 4% for ITGA10. It is the least tumour-specific of the three. That is the trade a developer makes for a target that is already in the clinic.
What we are not claiming
Nine of the 29 discovered targets are clustered protocadherins, and they score well. They sit in one tightly packed genomic locus, share long stretches of sequence, and are a known source of read-misassignment. We have left them in the tables so the numbers are complete and we are not counting them as findings. Anyone following this up should re-quantify that locus with a method designed for it before believing any of it.
Tabula Sapiens has no bone and no osteoblasts. Bone and osteoblast-lineage cells are particularly relevant references for osteosarcoma. Some of the specificity in the 0.20-weighted axis is therefore a gap in the reference rather than a property of the tumour, and it inflates every discovered target to some unknown degree. This is the largest single caveat in the study and it cannot be fixed without a bone reference.
This is one patient. The ranking is a statement about this person's tumour in 2024 and 2025. It is not a statement about osteosarcoma.
And all of it is RNA. RNA is not protein. A target present as message may be absent as protein at the cell surface, and the opposite happens too. GD2 makes the point: it is a genuine osteosarcoma target with an antibody in trials, and it is a lipid, so no transcriptomic method can see it at all. We scored its synthase B4GALNT1 as a proxy, which ranked 65th, and that number should not be read as a statement about GD2.
There is a way to check the protein question in this exact patient. Sitting unused in the project's raw data is a multiplexed proteomics measurement of the same two tissue cores, along with stained images of the same sections. Confirming the top three targets at protein level on thesame tissue is the obvious next step and it is not in this series.
The measurement that is still missing
Everything so far is expression: what is present, where, on how many cells. None of it is dose.
A radioligand's job is to deposit energy in a tumour, and how much energy actually arrives depends on how the drug gets out of the blood vessels, how far it diffuses, how tightly it binds, how quickly it is internalised, and how far the radiation travels once it decays. A target with modest coverage that sits next to every blood vessel can beat a target with excellent coverage buried in the middle of a dense region.
That calculation is the last part.
This case study is for research and exploratory purposes only. The results have not been clinically validated and should not be used to guide patient care.