Immune Cells Are There — So Why Aren't They Working?
Immune checkpoint inhibitors (ICIs) have transformed the landscape of oncology. PD-1/PD-L1 blocking antibodies have shown remarkable responses from melanoma to non-small cell lung cancer (NSCLC), ushering in the era of neoadjuvant chemoimmunotherapy.
Yet the reality remains sobering. Only 20–40% of patients respond to ICIs.
What makes this even more perplexing is that existing biomarkers fail to explain these failures:
Patients with high PD-L1 who don't respond
Patients with high TMB who show resistance
Patients whose tumors are rich in immune cells yet still fail therapy
If immune cells are present, why doesn't immunotherapy work?
The conventional approach asks: "Are immune cells present?" At Portrai, we ask a different question: "Where are they, in what arrangement, and next to which cells?"
The answer lies in Space.
Why "Space": What Averages Miss
Conventional approach: Homogenize the tumor. Run bulk RNA-seq, IHC, flow cytometry to obtain "averages." You learn that CD8+ T cells constitute 15%, but not whether those T cells are in the tumor core, trapped at the margins, or sitting directly next to immunosuppressive cells.
Spatial approach: Spatial transcriptomics and multiplex immunofluorescence (mIF) measure each cell's location and gene expression simultaneously on a coordinate system across the tissue. Not "how much is there," but "where, in what context, and adjacent to whom."
This matters because the mechanism of action of immunotherapy is inherently a spatial event. For PD-1 blockade to work, CD8+ T cells must be within physical contact distance of tumor cells. If T cells are trapped in stroma 200µm away, blocking PD-1 cannot kill cancer — no matter how effectively the checkpoint is released.
In our February blog, we established that "immune cells being present ≠ immune cells making contact." This month, we expand that proposition onto a larger canvas: immunotherapy resistance.
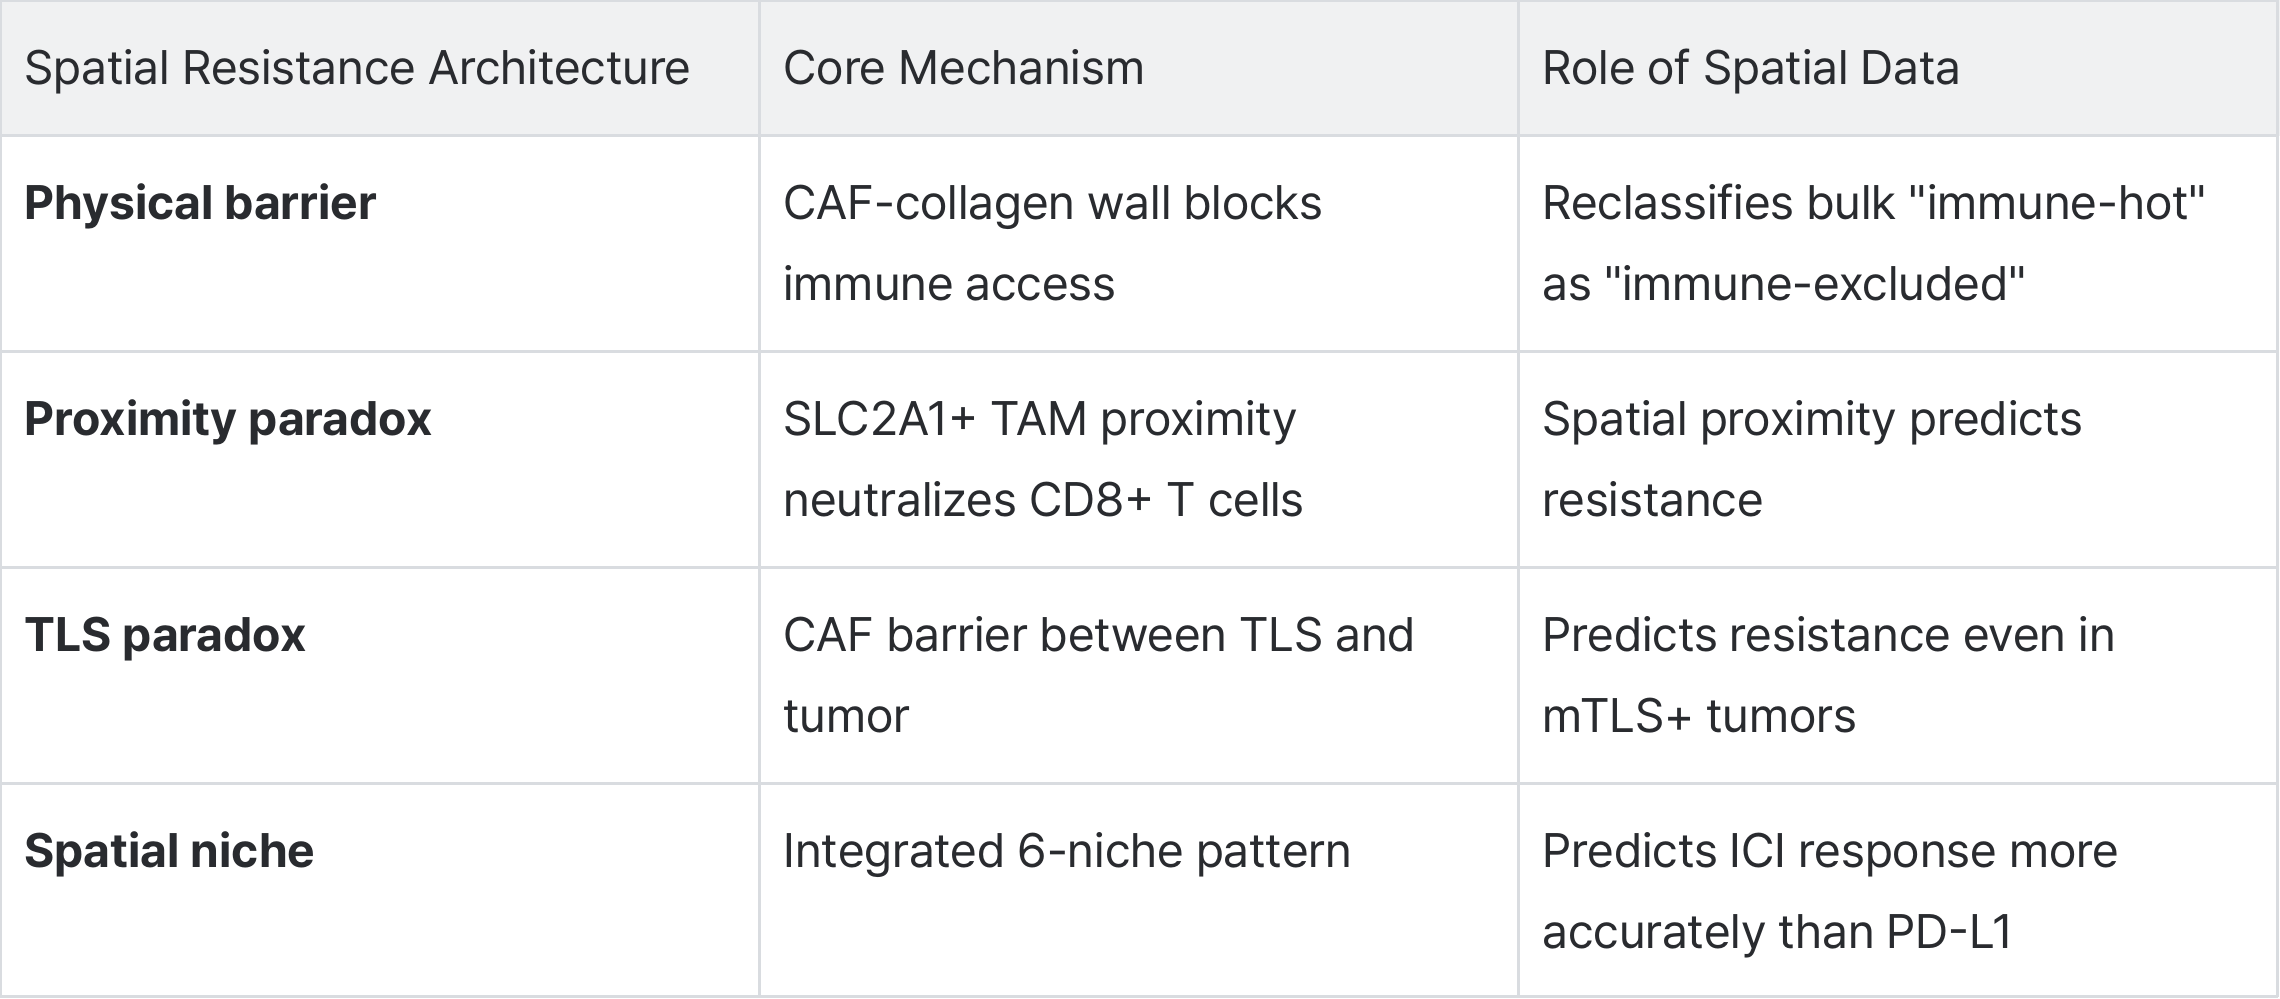
Spatial data reveals three distinct architectures driving ICI resistance.
Resistance Architecture 1: The Physical Wall — CAFs Building an Immune Barrier
Core question: Can immune cells reach the tumor?
The most intuitive spatial mechanism. Immune cells exist within the tumor but cannot physically access cancer cells.
Li et al.'s HCC study (Advanced Science, 2025) illustrates this clearly. Integrating spatial transcriptomics with snRNA-seq, they identified hypoxic metabolic myofibroblasts (hmmyCAFs) concentrated at the tumor's invasive front. These hmmyCAFs neutralize immunity through three mechanisms:
Physical blockade: Collagen-rich barriers excluding CD8+ T cells from the tumor
Molecular suppression: POSTN secretion suppressing checkpoint signaling
Metabolic crippling: Reprogramming T cell metabolism toward glycolysis under hypoxia
Homogenize this tumor and you conclude "immune cells are abundant." Map the space and a completely different picture emerges: "immune cells are abundant, but trapped outside the collagen wall." A tumor classified as "immune-hot" in bulk analysis gets reclassified as "immune-excluded" through spatial analysis.
The same pattern was confirmed in esophageal squamous cell carcinoma (Hong et al., J Transl Med, 2026). A LAMA3-SPP1 axis at the invasive front forms desmoplastic barriers that predict impaired anti-PD-L1 response.
Resistance Architecture 2: The Proximity Paradox — When "Close Enemies" Kill Immunity
Core question: If immune cells reached the tumor, who are they sitting next to?
If physical barriers prevent access altogether, the second architecture is more subtle. Even when immune cells successfully infiltrate, spatial proximity to immunosuppressive cells neutralizes anti-tumor immunity.
Wang et al. published a striking demonstration in Nature Cell Biology (2026). In NSCLC, they showed that SLC2A1+ tumor-associated macrophages (TAMs) — macrophages with high expression of the glucose transporter SLC2A1 — directly control CD8+ T cell spatial distribution and function.
Key findings:
SLC2A1+ TAM-enriched regions exhibit significantly reduced CD8+ T cell density
Spatial proximity between SLC2A1+ TAMs and CD8+ T cells predicts resistance to αPD-(L)1 therapy
TAM-specific Slc2a1 deletion restored CD8+ T cell spatial homogeneity and effector function, improving αPD-L1 efficacy
This goes beyond simply knowing "immunosuppressive cells are present." Within the same tumor, SLC2A1+ TAM-dense regions vs sparse regions show dramatically different CD8+ T cell distributions and functions. Homogenize the tumor and this critical difference vanishes.
The importance of spatial proximity was independently confirmed in melanoma. Gobbini et al. (Cancer Immunology Research, 2025) reported that the proximity and interactions between cDC1 (type 1 conventional dendritic cells) and CD8+ T cells were positively associated with ICI response in advanced melanoma patients.
Like the "20µm" and "150µm" thresholds from our February blog, spatial distance between immune cells is a defining variable of immunotherapy resistance. "Whether immune cells entered the tumor" matters less than "which cells they are adjacent to."
Resistance Architecture 3: The TLS Paradox — Losing Despite Having an Immune Outpost
Core question: If the immune cell "factory" exists, why does resistance still occur?
Tertiary lymphoid structures (TLS) are immune outposts within tumors and established predictors of ICI response. But recent research reveals an uncomfortable truth: a substantial proportion of patients with mature TLS still fail ICIs.
Peyraud et al. (Cell Reports Medicine, 2025) addressed this in a landmark study of 509 ICI-treated NSCLC patients (BIP study). Spatial analysis of mTLS-positive tumors that resisted ICIs identified two distinct CAF subsets as key mediators:
Immune exclusion: Blocking CD8+ T cell migration from TLS toward tumor
T cell exhaustion: Driving functional exhaustion of T cells that reached the tumor
Treg recruitment: Promoting immunosuppressive Treg infiltration
The key insight: TLS "producing" immune cells and those cells "reaching and functioning at the tumor" are separate spatial problems. When CAF barriers stand between TLS and tumor, the immune outpost becomes meaningless.
Spatial Niches: A New Predictive Grammar Beyond PD-L1
Integrating these three resistance architectures leads to a natural question: Can spatial patterns predict ICI response?
Lee et al. (J ImmunoTherapy Cancer, 2026) profiled cSCC specimens from 27 patients using single-cell spatial transcriptomics, identifying six spatial niches.
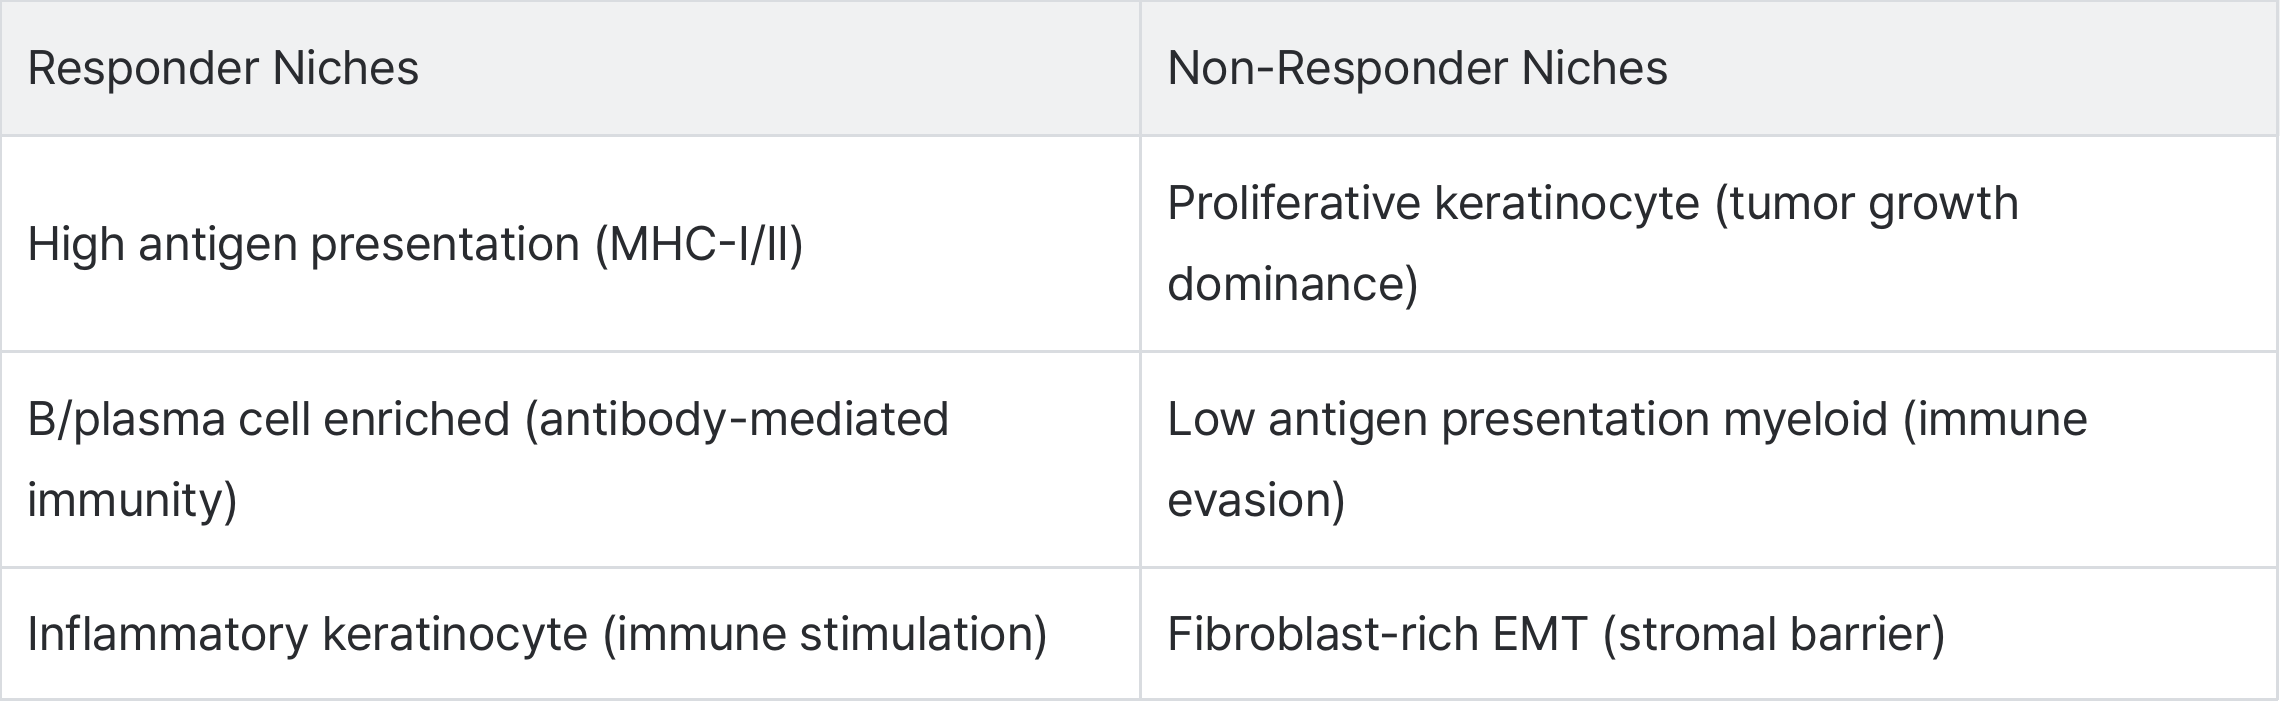
The most striking result: pretreatment spatial niche profiling outperformed PD-L1 in predicting pathologic response — using only 1.7mm tissue cores.
A paradigm shift in ICI biomarkers. From single molecules (PD-L1, TMB) to spatial patterns (spatial niches).
Toward Clinical Application: From Spatial Biomarkers to Foundation Models
The scientific value of spatial data is clear. What Portrai focuses on is connecting this spatial information to real clinical decision-making.
Spatial Biomarker Signatures: Multi-Cohort Validation
Aung et al. (Nature Genetics, 2025) applied spatial proteomics + spatial transcriptomics to 234 advanced NSCLC patients, building cell-to-gene signatures:
Resistance signature (proliferating tumor cells, granulocytes, vessels): Consistently predicted poor outcomes across three independent cohorts (HR = 5.3, 2.2, 1.7)
Response signature (M1/M2 macrophages, CD4 T cells): Predicted favorable outcomes (HR = 0.22, 0.38, 0.56)
Biomarkers derived from spatial data demonstrating reproducible predictive power across multiple cohorts. A qualitatively different class from PD-L1 or TMB — signatures derived from the spatial arrangement pattern of cells.
Foundation Models: Reading Spatial Information from H&E Slides
The power of spatial transcriptomics is clear, but a practical challenge remains — cost and accessibility. Performing spatial transcriptomics on every patient is not yet realistic.
This is where AI foundation models become game-changers. Path2Space, recently published in Cell, is a deep learning model trained on extensive spatial transcriptomics data that predicts spatial gene expression directly from routine H&E pathology slides. It outperformed 21 established methods and, applied to 976 TCGA breast cancers, accurately inferred cell-type compositions and identified spatially defined subgroups with distinct survival outcomes.
This is not merely technical convenience. H&E slides are a resource already available for virtually every cancer patient. Foundation models transform "spatial data producible at a handful of specialized centers" into "spatial information extractable from existing slides at any hospital." This is the democratization of spatial biology — and a critical accelerator for bringing spatial immunotherapy biomarkers into clinical practice.
What Portrai Is Building
At AACR 2026 in April, Portrai presented two studies. Both read as central to this month's discussion.
ADC study: In a breast cancer cohort treated with HER2-targeting ADC (T-DXd), spatial transcriptomics identified pharmacokinetic barriers and tumor-intrinsic resistance determinants. This demonstrated — with real patient data — that "vessel-to-target distance" and "spatial heterogeneity of HER2 expression" from our March blog determine ADC response. This is the ADC version of this blog's "physical barrier": whether it's drugs or immune cells, spatial accessibility within the tumor dictates therapeutic success.
IO resistance study: In NSCLC after neoadjuvant chemoimmunotherapy, spatial transcriptomics identified core resistance niches distinguishing MPR from non-MPR — defined not by a single cell type but by the spatial arrangement and distance relationships among immunosuppressive cells, stromal cells, and residual tumor cells. Physical barriers, proximity-based suppression, and spatial isolation of immune cells operating as an integrated structure.
The message unifying both studies: Regardless of drug modality — ADC or IO — the essence of treatment response and resistance is determined on the spatial landscape of the tumor.
Portrai operates a platform based on over 2,000 clinically annotated tumor samples and spatial transcriptomics, decoding these spatial resistance architectures and supporting next-generation biomarker discovery and combination strategy design. What we do is not simply "viewing" spatial data. It is reading, interpreting, and translating spatial data into clinical decisions.
Conclusion: Unfolding the Map of Resistance
Conventional ICI resistance research has operated on two dimensions:
Molecular level: PD-L1, TMB, MSI
Cellular level: T cell exhaustion, Treg ratios, MDSCs
Both matter, but a critical dimension has been missing: how those molecules and cells are arranged in the spatial context of the tumor.
In March we said "the next language of ADC development is space." In April at AACR, "spatial biology is now a constant." In May, "view the therapeutic window spatially." This month, we used that spatial language to read immunotherapy resistance — oncology's most urgent challenge.
Checkpoint inhibitors don't stall because immune cells are absent. They stall because immune cells aren't where they need to be, in the arrangement they need to be in. The answers are already written across the spatial landscape of the tumor. We are unfolding that map.
References
Li Y, Huan C, Sun H, et al. Spatial Transcriptomics and snRNA-seq Expose CAF Niches Orchestrating Dual Stromal-Immune Barriers in Hepatocellular Carcinoma. Advanced Science. 2025;12(48):e14661. DOI: 10.1002/advs.202514661
Hong K, Pa C, Zhu Y, et al. Dissecting the immunosuppressive microenvironment of LAMA3+ malignant cells and SPP1+ macrophages in esophageal squamous cell carcinoma using single-cell and spatial transcriptomics. Journal of Translational Medicine. 2026;24(1). DOI: 10.1186/s12967-026-08004-5
Wang L, Chu H, Chen D, et al. SLC2A1+ tumour-associated macrophages spatially control CD8+ T cell function and drive resistance to immunotherapy in non-small-cell lung cancer. Nature Cell Biology. 2026;28(2):338-348. DOI: 10.1038/s41556-025-01840-5
Gobbini E, Hubert M, Doffin AC, et al. The Spatial Organization of cDC1 with CD8+ T Cells is Critical for the Response to Immune Checkpoint Inhibitors in Patients with Melanoma. Cancer Immunology Research. 2025;13(4):517-526. DOI: 10.1158/2326-6066.CIR-24-0421
Peyraud F, Guégan JP, Rey C, et al. Spatially resolved transcriptomics reveal the determinants of primary resistance to immunotherapy in NSCLC with mature tertiary lymphoid structures. Cell Reports Medicine. 2025;6(2):101934. DOI: 10.1016/j.xcrm.2025.101934
Lee MY, Sherman AR, Martinez Ramirez L, et al. Single-cell spatial transcriptomics uncovers niches that govern response to PD-1/PD-L1 blockade in cutaneous squamous cell carcinoma. Journal for ImmunoTherapy of Cancer. 2026;14(1). DOI: 10.1136/jitc-2025-014067
Aung TN, Monkman J, Warrell J, et al. Spatial signatures for predicting immunotherapy outcomes using multi-omics in non-small cell lung cancer. Nature Genetics. 2025;57(10):2482-2493. DOI: 10.1038/s41588-025-02351-7
Path2Space. AI-predicted spatial transcriptomics unlocks breast cancer biomarkers from pathology. Cell. 2026. DOI: 10.1016/j.cell.2026.04.015
Zhang H, Hong L, Dong Z, et al. Spatially resolved C1QC macrophage-CD4 T cell niche in colorectal cancer microenvironment: implications for immunotherapy response. Cell Discovery. 2025;11(1):60. DOI: 10.1038/s41421-025-00811-2
Portrai, AACR 2026 Poster. Spatial Transcriptomics uncovers pharmacokinetic barriers and tumor-intrinsic determinants of resistance to trastuzumab deruxtecan in breast cancer.
Portrai, AACR 2026 Poster. Spatial Transcriptomics reveals core resistance niches distinguishing non-MPR from MPR in NSCLC after neoadjuvant chemoimmunotherapy.